27Mar
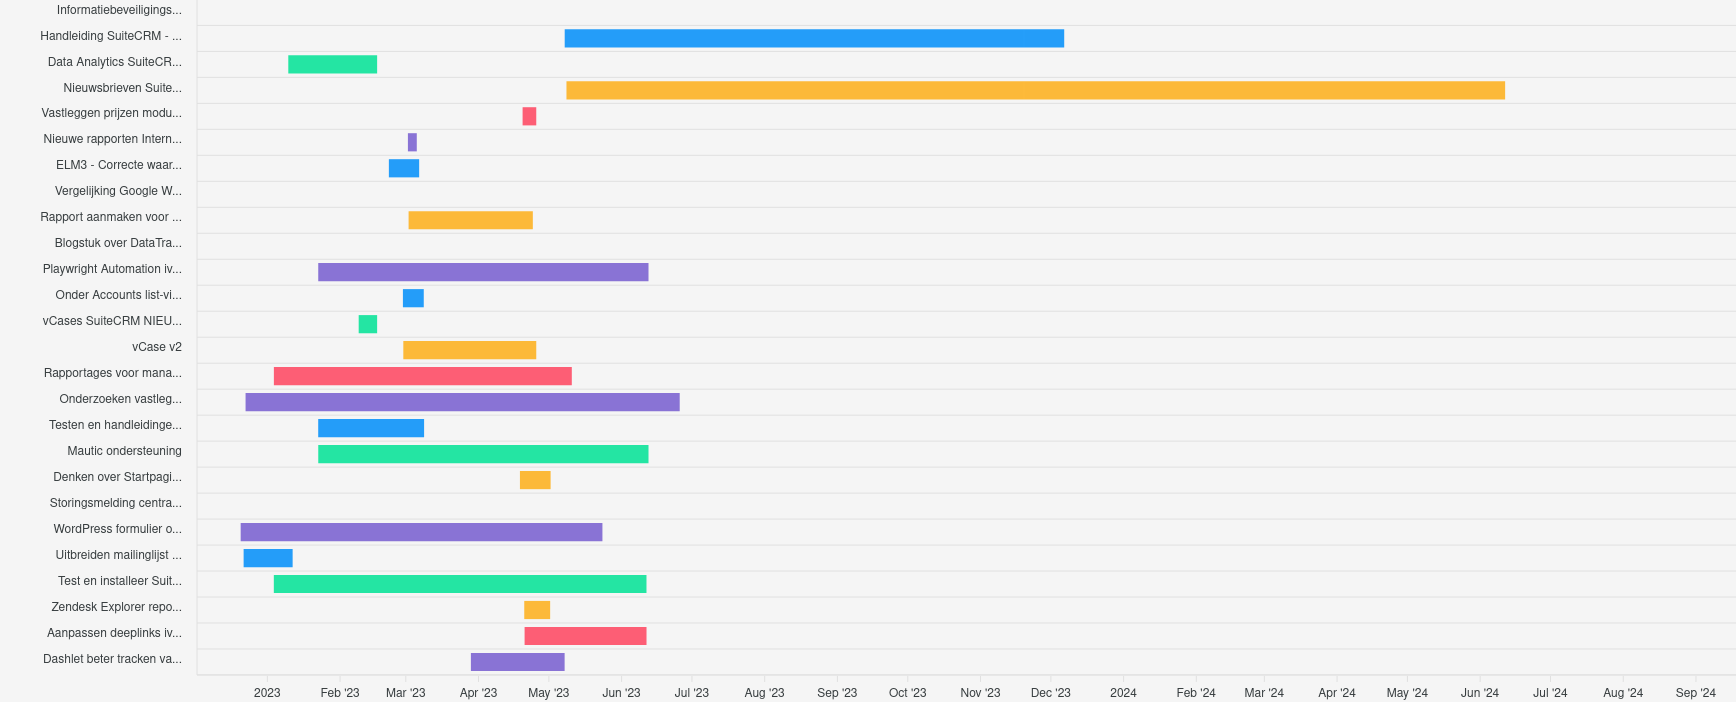
New graphic type: time line
Available for some time already, but never publicly announced. A new chart type is now available in our SuiteCRM SaaS/cloud solution: the timeline.
This makes it possible to visually represent data with a start and end date on a timeline. This projection gives a visual insight into, for example:
- How long does it take for us to resolve a (support) case?
- Is it true that for certain types of customers, it takes longer to secure an opportunity?
- A graphical representation of the Project tasks under Projects and how they follow one another. (In case you don’t want to use our advanced Projects module.)”